Business template
Logistics Ops Dashboard
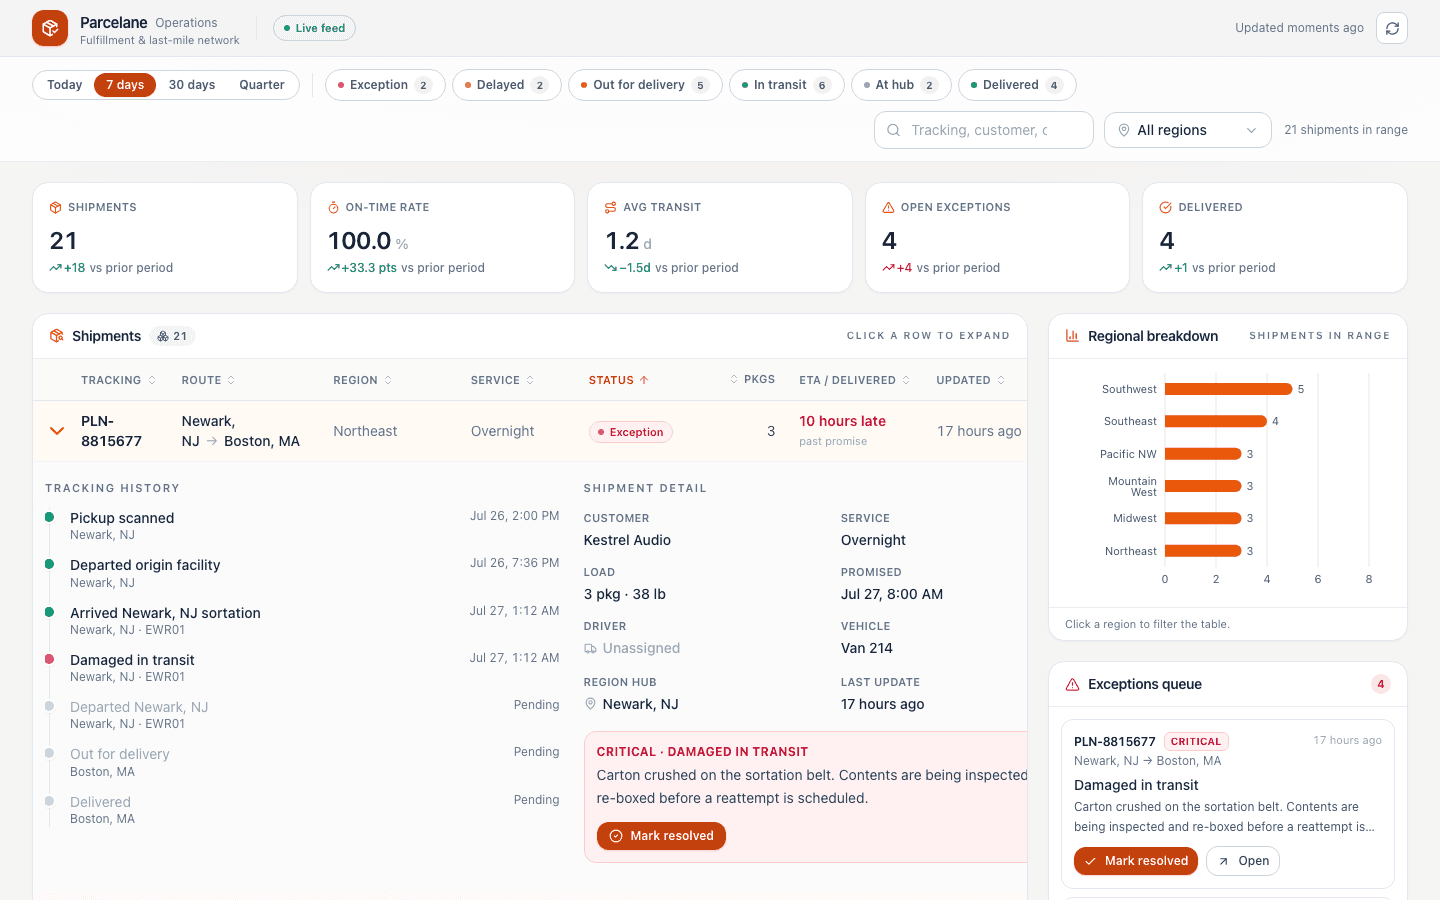
Logistics operations dashboard with shipment KPIs, a dense sortable shipments table, and exception tracking.
Build this Checked before it goes live
Who it is for
Logistics and fulfilment teams tracking shipments and exceptions.
What it does
- Track consignments and status
- Spot delivery exceptions
- Monitor fleet or route load
Common in
LogisticsSupply chainEcommerce
The brief we build from
This is the exact instruction PromptUI starts with. You can change every word of it before or after the first build.
Build Parcelane, an operations control tower for our fulfillment and last-mile delivery network. I run dispatch and I want a single dense screen — no side navigation, everything reachable from a top filter bar.

Across the top put a row of KPI cards: total shipments in range, on-time rate, average transit time, open exceptions, and delivered count — each with a small up/down delta versus the prior period.

The hero of the page is a dense shipments table. Columns for tracking number, route (origin → destination), region, service level, a colored status chip, package count, an ETA / delivered cell that reads "in 3 hours" or "6 hours late", and when it was last updated. Every column header must actually sort, ascending/descending, and clicking a row should expand it in place to show the full tracking-history timeline (pickup scan, hub sortation, out for delivery, delivered), the customer, load weight, assigned driver and vehicle, and — if something went wrong — the exception detail with a "mark resolved" button. Each row also needs a little actions menu (notify customer, add a note, resolve).

On the right, a regional breakdown bar chart showing shipment volume per region; clicking a bar should filter the table to that region. Under it, an exceptions queue that lists everything currently delayed or in exception with a severity tag and a resolve button, so my team can work the problems top-down.

Filters live in the top bar: date-range chips (Today, 7 days, 30 days, Quarter), status filter chips with live counts, a region dropdown, and a search box for tracking numbers, customers, or cities. Show how many shipments match and a clear-filters link.

Design it like a calm operator cockpit: a warm stone/gray paper background, cool slate data ink, one deep-orange accent for anything live or actionable, and a fixed set of status colors. Data-dense but never noisy, tabular numerals so the columns line up, and the table clearly the center of gravity. Use realistic logistics data — real-sounding cities, routes, tracking IDs, carriers, and believable exceptions like weather holds and missed connections.
Other business templates
SaaS Dashboard
Admin dashboard with sidebar, metric cards, a data table, and dark-mode toggle.
Admin Panel
Full CRUD admin panel with users table, search, and modals.
Analytics Dashboard
Data analytics dashboard with charts, filters, and data tables.
Settings Page
User settings page with profile, notifications, billing, and security tabs.
Start from this template
PromptUI builds it, checks that it actually runs, and helps you put it online. Free to start.
Build this